Understanding Crawl Budget
The terminology refers to how much attention you get from search engine crawling and indexing is called “crawl budget” or “crawl rate.”
Crawl budget refers to the amount of time and resources that search engines allocate to crawl and index a website. It is determined by various factors, including the website’s size, structure, quality, and popularity.
Crawl rate refers to the speed at which search engines crawl a website. It can be influenced by the website’s server response time, the amount of new content being added, and the website’s overall popularity and importance.
Both crawl budget and crawl rate are important considerations for website owners and SEO professionals as they affect how search engines perceive and rank a website in their search results.
Use CloudWatch for Crawl Analysis
AWS CloudWatch is a monitoring and management service provided by Amazon Web Services (AWS) that helps you collect and track metrics, collect and monitor log files, and set alarms. It provides you with a unified view of your resources, applications, and services that run on AWS as well as on-premises servers.
With CloudWatch, you can monitor metrics for resources such as EC2 instances, RDS DB instances, and Elastic Load Balancers, as well as custom metrics generated by your applications and services. You can also use CloudWatch to monitor and analyze log files from your applications and services, and set alarms based on specific thresholds.
CloudWatch also enables you to gain insights into the performance and health of your applications and services, by providing dashboards and visualisations that allow you to analyse and troubleshoot issues in real-time. You can use CloudWatch to automate operational tasks, such as scaling resources up or down based on performance metrics, and to gain a better understanding of your overall AWS infrastructure performance.
How to Filter Crawl Activities in CloudWatch Log Insights
To filter a specific search engine crawl stats such as Googlebot, go to CloudWatch -> Logs -> Logs Insights. Choose your log group, and in this case it’s your serve access log.
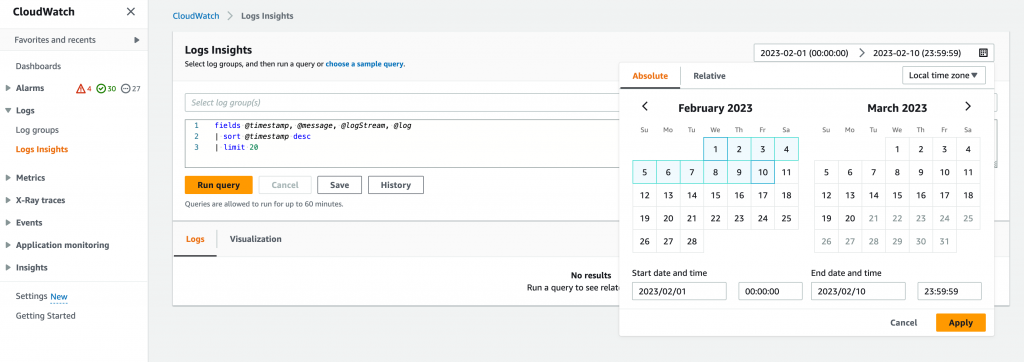
Notice that Logs Insight query can only return a maximum of 10,000 results, so be sure to select a suitable date range so your filtered results will be less than 10,000. Use below query to filter specific bot crawl activities:
fields @timestamp, @message
| filter @message like 'Googlebot'
| filter @message like '/blog/'
| sort @timestamp desc
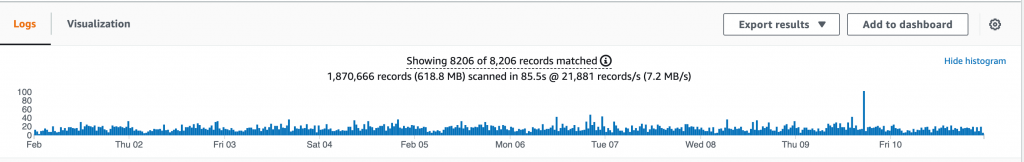
| limit 10000It’s recommended to set the limit 10,000, otherwise it will be defaulted to 1,000 entries. You can either filter a specific sub directory such as blog or a category, or the entire site by removing the second filter.
Upon executing the query, a list of all the results and a histogram depicting the frequency and duration of your website’s crawling by Google will be generated. Consistently monitoring this information can provide a clearer understanding of your website’s Crawl Budget and Crawl Rate. By analysing the crawl stats, content activities, and search query reports, you can gain valuable insights into the effectiveness of your search engine optimisation efforts over a period of time.
More examples of how to analyse your access logs can be found in CloudWatch documentations.